S
SpaceX
SPCXPro trackingFREE FULL ANALYSISSpace Exploration Technologies Corp. · Nasdaq Global Select Market / Nasdaq Texas · Space, connectivity & AI infrastructure · Saved report · data as of 2026/08/14 · SEC checked 2026-10-07
One-minute decisionWATCHSource completeness · 96%
Research-worthy, but valuation and supply risk demand discipline
SpaceX delivered 91.9% Q2 revenue growth and $3.538B of adjusted EBITDA, but still reported a $541M GAAP loss. The IPO valued the company at about $1.776T while Musk retained 82.3% voting power and a large staged unlock schedule remains ahead.
- Business and development direction
An integrated launch, satellite-connectivity and AI-infrastructure platform.
Current business Space, connectivity & AI infrastructure100%
Future development AI compute infrastructure
Launch systems
Satellite networks
DECISION DRIVERS
Three risks and three checkpoints
High · Structure
Structure
Musk retains 82.3% voting power through the dual-class structure.
High · Valuation
Valuation
The IPO value was about 95× FY2025 revenue.
High · Execution
Execution
H1 property and equipment purchases were $28.476B versus $12.508B of revenue.
IPO177 DEAL QUALITY SCORE · DQ-1.0
Open scoring method →41/100 · Structurally weak
Largest deduction: Dilution and supply (15/100).
View score breakdown and methodology +
Transaction structure25%
46/100Terms, primary/secondary mix, warrants and offering route.
Shareholder alignment20%
42/100Control concentration, selling-holder liquidity and sponsor economics.
Dilution and supply20%
15/100Potential tradable-supply multiple; unknown terms score conservatively.
Use of proceeds15%
40/100Issuer capital formation, growth use, debt repayment and selling-holder share.
Valuation reasonableness15%
49/100Filed valuation alerts and completeness of the price/share basis.
Disclosure completeness5%
96/100Same reconciled evidence-completeness measure shown in the public brief.
Weighted score = sum of each factor score × its stated weight. Inputs are the reconciled 424B4 + Q2 10-Q terms. Missing terms receive a conservative neutral-to-weak score.
BOOKRUNNERS / LEAD UNDERWRITERSJoint book-running managers
CONFIRMED- 1Goldman Sachs & Co. LLC20.00%111,111,111 shares
- 2Morgan Stanley & Co. LLC20.00%111,111,111 shares
- 3BofA Securities, Inc.15.00%83,333,333 shares
View all 22 institutions +
- 4Citigroup Global Markets Inc.15.00%83,333,333 shares
- 5J.P. Morgan Securities LLC15.00%83,333,333 shares
- 6Barclays Capital Inc.2.00%11,111,111 shares
- 7Deutsche Bank Securities Inc.2.00%11,111,111 shares
- 8RBC Capital Markets, LLC2.00%11,111,111 shares
- 9UBS Securities LLC2.00%11,111,111 shares
- 10Wells Fargo Securities, LLC2.00%11,111,111 shares
- 11Banco BTG Pactual S.A. – Cayman Branch0.42%2,314,815 shares
- 12ING Bank N.V.0.42%2,314,815 shares
- 13Macquarie Capital (USA) Inc.0.42%2,314,815 shares
- 14Mirae Asset Securities Co., Ltd.0.42%2,314,815 shares
- 15Mizuho Securities USA LLC0.42%2,314,815 shares
- 16Santander US Capital Markets LLC0.42%2,314,815 shares
- 17Cantor Fitzgerald & Co.0.42%2,314,815 shares
- 18Needham & Company, LLC0.42%2,314,815 shares
- 19Raymond James & Associates, Inc.0.42%2,314,815 shares
- 20SG Americas Securities, LLC0.42%2,314,814 shares
- 21Stifel, Nicolaus & Company, Incorporated0.42%2,314,815 shares
- 22William Blair & Company, L.L.C.0.42%2,314,815 shares
IPO CAPITAL QUALITY
Issuer capital$85.675B
Selling-holder liquidity$0
primary100%
Secondary shares0%
100%
primary · SharesSecondary shares · Shares
| Calculation | Reported value |
|---|---|
| Issuer capital | $85.675B |
| Selling-holder liquidity | $0 |
| Use of proceeds | Reported value |
|---|---|
| Company capital formation | 100% |
Basis and evidence
Share-type basis from the final prospectus; issuance costs remain separate from this ratio.
The disclosed IPO shares were primary, so the transaction principally raised capital for the issuer rather than providing selling-holder liquidity.
Dilution and valuation
IPO price$135.00
Basic post-offer13.0759B
Fully diluted sharesAwaiting verification
Value$1.765T
| Calculation | Shares | Value | Reference |
|---|---|---|---|
| Pre-offer shares | 12.5203B | $1.690T | $135.00 |
| Base post-offer | 13.0759B | $1.765T | +4.4% |
| Full option post-offer | 13.1592B | $1.776T | +5.1% |
| June 30 actual shares | 13.1760B | $1.779T* | at IPO price |
Share-count comparison
SharesOffering cases as stated in the saved report, not funding-round history or shareholder-group ownership.
Pre-offer shares
Share-count change
Base post-offer
| Stage / scenario | Reported value |
|---|---|
| Pre-offer shares | 12.5203B |
| Base post-offer | 13.0759B |
| Full option post-offer | 13.1592B |
| June 30 actual shares | 13.1760B |
Basis and evidence
Net change between the stated pre-offer and base post-offer share counts. Secondary transfers do not add shares. 13075900000 - 12520300000 = 555600000
Pre-offer shares
Share count on the saved valuation table's stated basis. Option and plan-reserve cases are conditional, not confirmed issued shares.
Capitalization / saved valuation bridge ↗Base post-offer
Share count on the saved valuation table's stated basis. Option and plan-reserve cases are conditional, not confirmed issued shares.
Capitalization / saved valuation bridge ↗Full option post-offer
Share count on the saved valuation table's stated basis. Option and plan-reserve cases are conditional, not confirmed issued shares.
Capitalization / saved valuation bridge ↗June 30 actual shares
Share count on the saved valuation table's stated basis. Option and plan-reserve cases are conditional, not confirmed issued shares.
Capitalization / saved valuation bridge ↗Ownership across stages
| Status | Reference |
|---|---|
| Awaiting verification | Source ↗ |
IPO valuation scenario simulator
ADVANCED SCENARIO LAB
IPO valuation scenario simulator
Base post-offer · $1.765T · 13.0759B
Enterprise value is not shown unless net debt is separately verified. This calculator changes the filed scenario mechanically; it does not predict demand, allocation or trading performance.
CONTROLLING PARTYElon Musk
Post-offer, after full option exercise
- Voting
- 82.3%
- Economic
- ~48.8%
- As of
- 2026/08/14
!Dual-class: Class B carries 10 votes per shareView source ↗
Relationship filters
ownership / voting rights
share structure
| Entity / holder | Economic ownership | Voting power / rights | Relationship |
|---|---|---|---|
| Elon Musk economic interest | ~48.8% | 82.3% | Controlling party |
| Other existing holders | ~46.3% | Not separately disclosed | Major ownership group |
| IPO investors | ~4.9% | Not separately disclosed | Public / new investors |
Select for details · Elon Musk economic interest
Musk voting power82.3%
- Elon Musk economic interest ~48.8%
- Other existing holders ~46.3%
- IPO investors ~4.9%
Why control differs from ownership
✓Class A carries one vote; Class B carries ten votes per share.
✓Musk retained 82.3% of voting power after the full option exercise.
✓SpaceX qualifies as a Nasdaq controlled company.
✓New IPO investors held about 4.9% of post-offer shares.
POTENTIAL SUPPLY PRESSUREHigh
About 7.8B shares are covered by extended staged lock-ups — roughly 12.2× the 638.89M shares sold in the IPO. This compares the scale of the restricted pool with the IPO deal; it is not an additive float forecast.
- Initial float
- 638.89M
- Potential float
- ~7.8B
- Multiple
- ~12.2×
- Increase
- N/A*
Conditional lock-up timeline
Conditional lock-up timeline
Eligibility is not a sale. Release conditions, holder groups and exceptions remain separate.
Milestones and unconfirmed releases
| Holder / event | Term / date | Conditions |
|---|---|---|
| Q2 earnings | 2026/08/04 first regular tranche eligible | Q2 earnings · Eligible holders in the regular lock-up pool · August 4, 2026 · Q2 earnings release plus the conditions in the final lock-up terms · Cumulative: Share total requires class-level reconciliation (Up to 20%) · Calculate released shares ÷ 20-day average daily volume after 20 trading sessions. |
| Q3 earnings | Date not announced earnings-linked regular tranche | Q3 earnings · Eligible holders in the regular lock-up pool · Not announced · Q3 earnings release and the conditions in the final lock-up terms · Cumulative: Regular-pool cumulative eligibility (Up to 69%) · Calculate released shares ÷ 20-day average daily volume after 20 trading sessions. |
Calendar dates from 2026-08-21
- +70 days70 calendar days after listing, subject to final lock-up conditions
- +90 days90 calendar days after listing, subject to final lock-up conditions
- +105 days105 calendar days after listing, subject to final lock-up conditions
- Founder lock-upFounder restriction period; any early waiver must be disclosed
| Holder / event | Term / date | Conditions |
|---|---|---|
| +70 days | 2026/08/21 7% · scheduled regular tranche | 70 calendar days after listing, subject to final lock-up conditions |
| +90 days | 2026/09/10 7% · scheduled regular tranche | 90 calendar days after listing, subject to final lock-up conditions |
| +105 days | 2026/09/25 7% · scheduled regular tranche | 105 calendar days after listing, subject to final lock-up conditions |
| Founder lock-up | 2027/06/12 +366 days · Musk shares remain restricted | Founder restriction period; any early waiver must be disclosed |
Basis and evidence
Q2 earnings
Q2 earnings · Eligible holders in the regular lock-up pool · August 4, 2026 · Q2 earnings release plus the conditions in the final lock-up terms · Cumulative: Share total requires class-level reconciliation (Up to 20%) · Calculate released shares ÷ 20-day average daily volume after 20 trading sessions.
Lock-up / shares eligible for future sale ↗+70 days
+70 days · Eligible holders in the regular lock-up pool · August 21, 2026 · 70 calendar days after listing, subject to final lock-up conditions · Cumulative: Regular-pool cumulative eligibility (Up to 27%) · Calculate released shares ÷ 20-day average daily volume after 20 trading sessions.
Lock-up / shares eligible for future sale ↗+90 days
+90 days · Eligible holders in the regular lock-up pool · September 10, 2026 · 90 calendar days after listing, subject to final lock-up conditions · Cumulative: Regular-pool cumulative eligibility (Up to 34%) · Calculate released shares ÷ 20-day average daily volume after 20 trading sessions.
Lock-up / shares eligible for future sale ↗+105 days
+105 days · Eligible holders in the regular lock-up pool · September 25, 2026 · 105 calendar days after listing, subject to final lock-up conditions · Cumulative: Regular-pool cumulative eligibility (Up to 41%) · Calculate released shares ÷ 20-day average daily volume after 20 trading sessions.
Lock-up / shares eligible for future sale ↗Q3 earnings
Q3 earnings · Eligible holders in the regular lock-up pool · Not announced · Q3 earnings release and the conditions in the final lock-up terms · Cumulative: Regular-pool cumulative eligibility (Up to 69%) · Calculate released shares ÷ 20-day average daily volume after 20 trading sessions.
Lock-up / shares eligible for future sale ↗Founder lock-up
Founder lock-up · Elon Musk / founder-controlled shares · June 12, 2027 · Founder restriction period; any early waiver must be disclosed · Cumulative: Not combined with the regular-pool percentages (Separate*) · Calculate released shares ÷ 20-day average daily volume after 20 trading sessions.
Lock-up / shares eligible for future sale ↗Financial quality
| Calculation | Reported value | Reference |
|---|---|---|
| Q2 revenue | $7.814B | +91.9% |
| Q2 adjusted EBITDA | $3.538B | +191.4% |
| Q2 net loss | $(541M) | 46.3% narrower |
| Cash + securities | $100.009B | 2026/06/30 |
| Contracted backlog | $47.461B | 56% within one year |
Financial review
| Status | Reference |
|---|---|
| Awaiting verification | Source ↗ |
LATEST COMPARISON
Open 424B4 + Q2 10-Q ↗8-K → 10-Q
The latest material signals and their investor impact are shown below.
Why it mattersUpdates operating momentum, runway and valuation multiples.
Evidence · 10-Q · 2026/08/04Why it mattersUpdates operating momentum, runway and valuation multiples.
Evidence · 10-Q · 2026/08/04S-1
• Initial public registration
• Business, risks and capital structure
S-1/A
• Offering terms updated
• Dilution and ownership reconciled
EFFECT / PRICING
• Registration declared effective
• $135 price announced
424B4
• Final prospectus filed
• Trading began under SPCX
8-K
• IPO closed with full option
• 638.89M shares sold
10-Q
• Q2 revenue $7.814B
• Net loss $541M; liquidity $100.009B
Musk retains 82.3% voting power through the dual-class structure.
- Potential impact
- High
- Monitor
- Next supply event
- Evidence
- 424B4 + Q2 10-Q · 2026/08/14 ↗
The IPO value was about 95× FY2025 revenue.
- Potential impact
- High
- Monitor
- Next supply event
- Evidence
- 424B4 + Q2 10-Q · 2026/08/14 ↗
H1 property and equipment purchases were $28.476B versus $12.508B of revenue.
- Potential impact
- High
- Monitor
- Next supply event
- Evidence
- 424B4 + Q2 10-Q · 2026/08/14 ↗
About 7.8B shares are subject to extended staged lock-ups, creating future supply risk.
- Potential impact
- High
- Monitor
- Next supply event
- Evidence
- 424B4 + Q2 10-Q · 2026/08/14 ↗
The two largest customers represented 37.8% of Q2 revenue.
- Potential impact
- Medium
- Monitor
- Next supply event
- Evidence
- 424B4 + Q2 10-Q · 2026/08/14 ↗
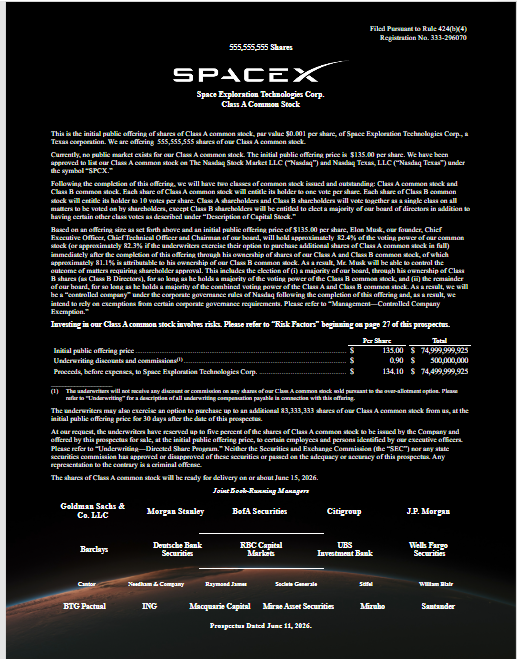
Document424B4 + Q2 10-Q✓ Verified against the SEC source · Final prospectus
Filed2026/06/126 public filings identified
Research updated2026/08/14SEC EDGAR
Evidence coverage96%Final prospectus, closing filing and Q2 10-Q reconciled
What remains missing4% of the evidence set remains unresolved. This may affect unconfirmed pricing, valuation, dilution or supply conclusions; no missing term is estimated.
View the filing's actual first page +